Notion is a powerful tool for managing projects and goals. With a bit of wizardry, you can automatically calculate and visualize their progress, providing quick insights and helpful new database views.
Through two practical examples, this guide demonstrates how to calculate and visualize the progress of projects and objectives. For your reference as you practice, those examples are available as a template on Notion Market.
Here’s what you’ll learn:
Calculate project progress.
A project typically comprises a series of tasks, and the percentage of completed tasks represents the project’s progress.
Intelligent Notion workspaces, including The Bulletproof Workspace, store all projects and tasks in master Projects and Tasks databases. Using reciprocal Relation properties, those databases are related to facilitate parent-child relationships. Each task is related to its project, and each project can then display its tasks within its inner page.
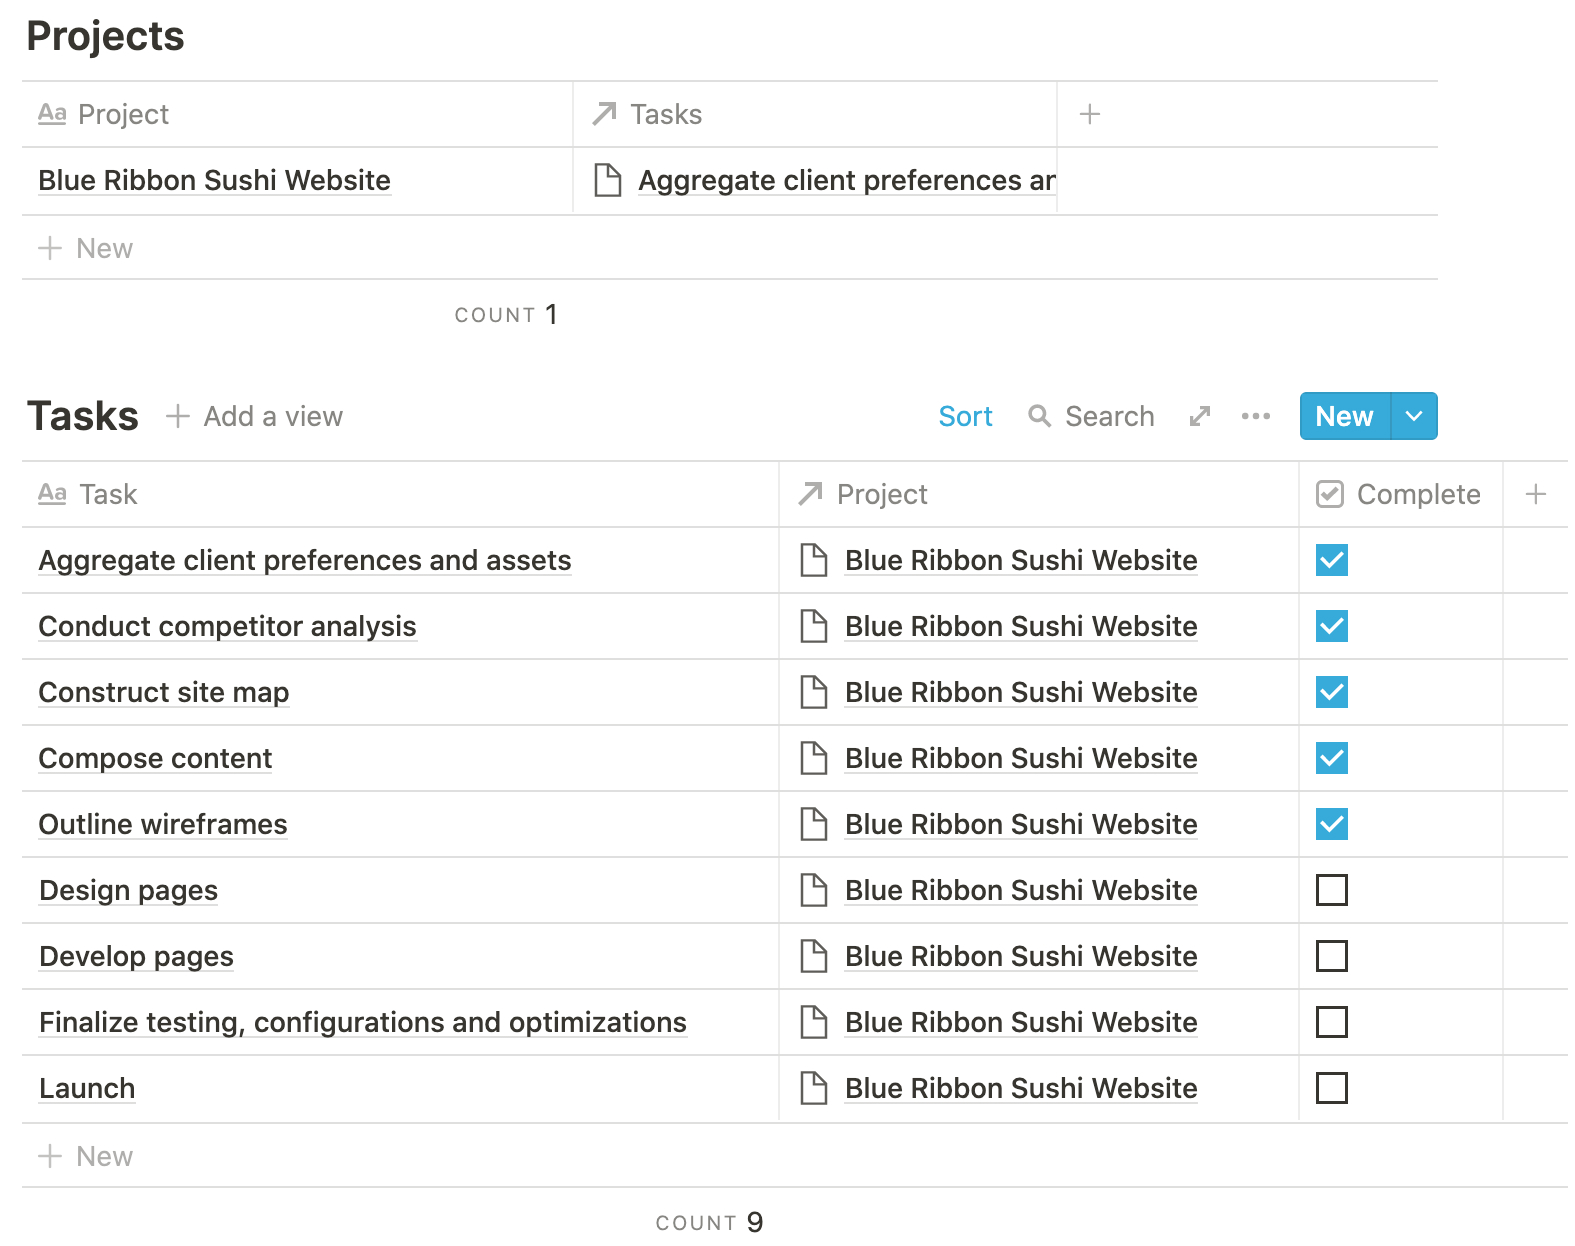
Here’s a simplified example of related Projects and Tasks databases, where all tasks relate to the sole project:

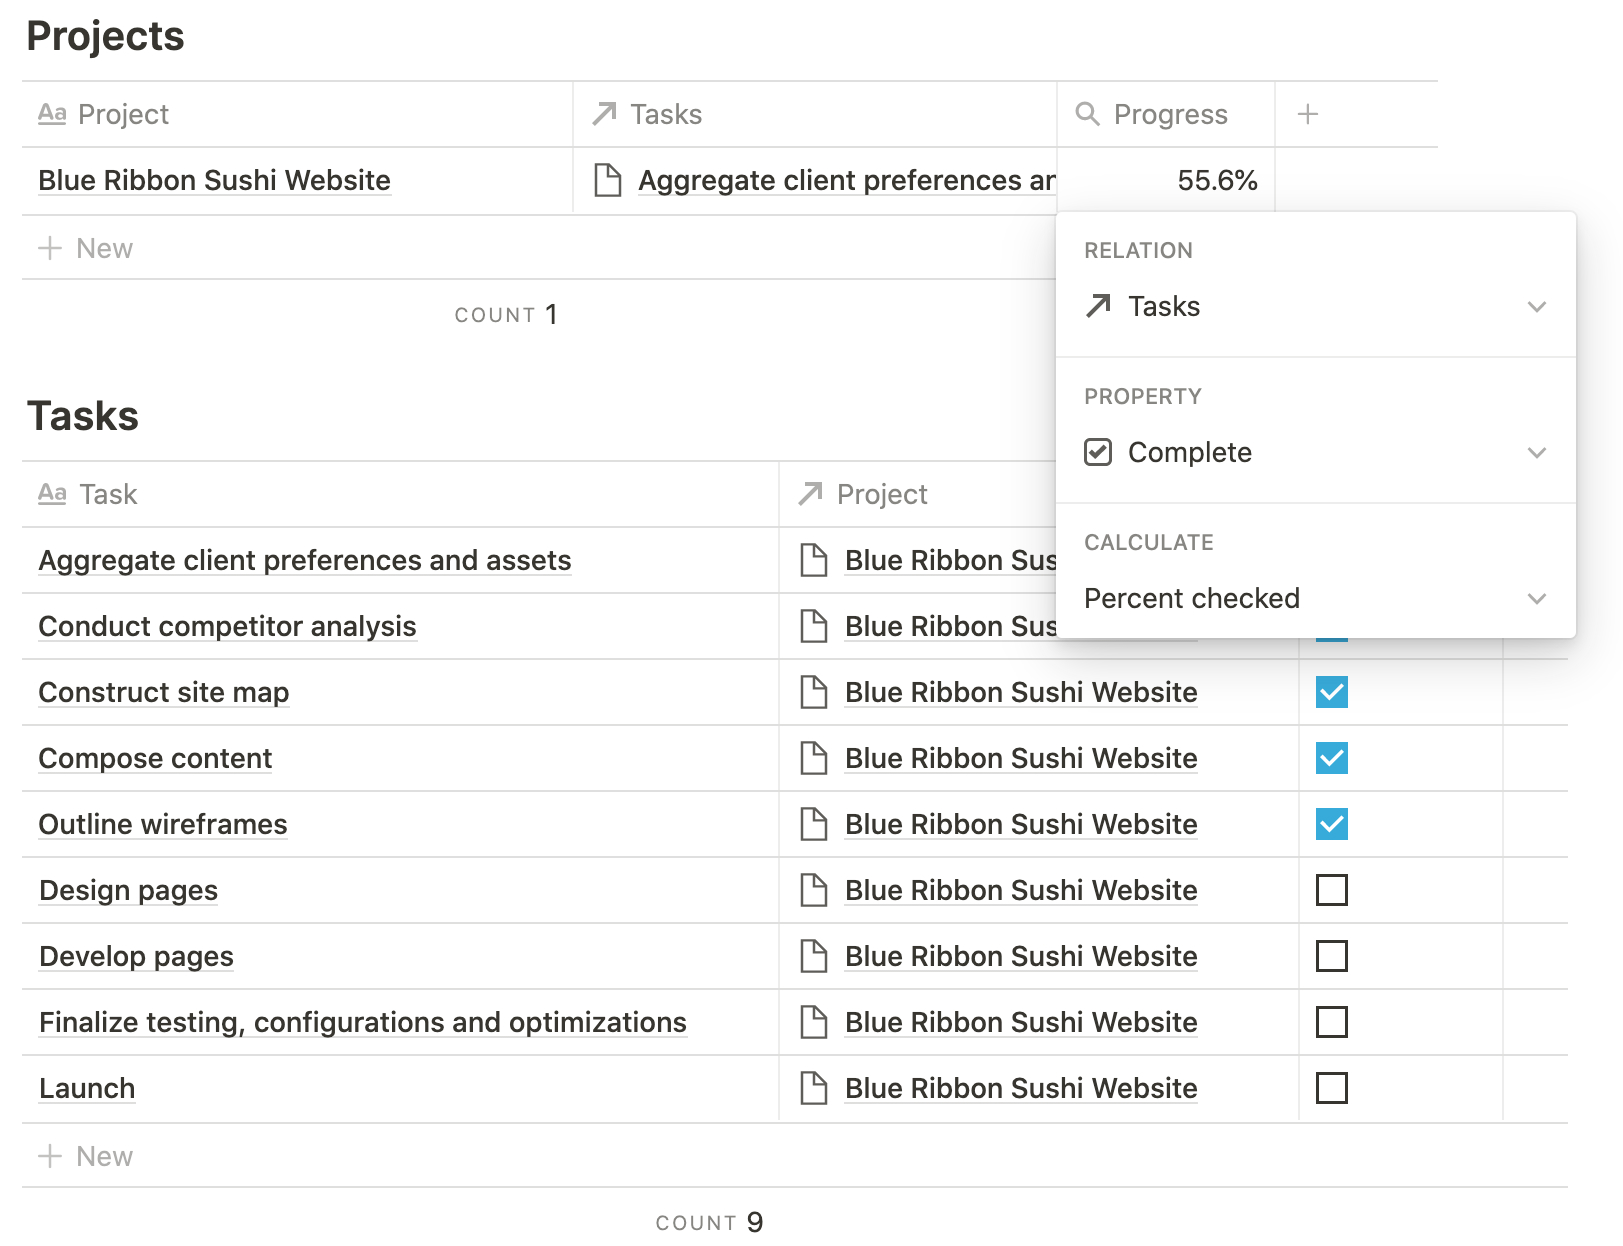
Thanks to those Relations, a project can use a Rollup property to retrieve the Checkboxes of its tasks. When configuring that Rollup, you can opt to calculate the Percent checked, thus returning the project’s progress:

For our sample project, because five of nine tasks are complete, the Progress value is 55.6%.
Calculate OKR progress.
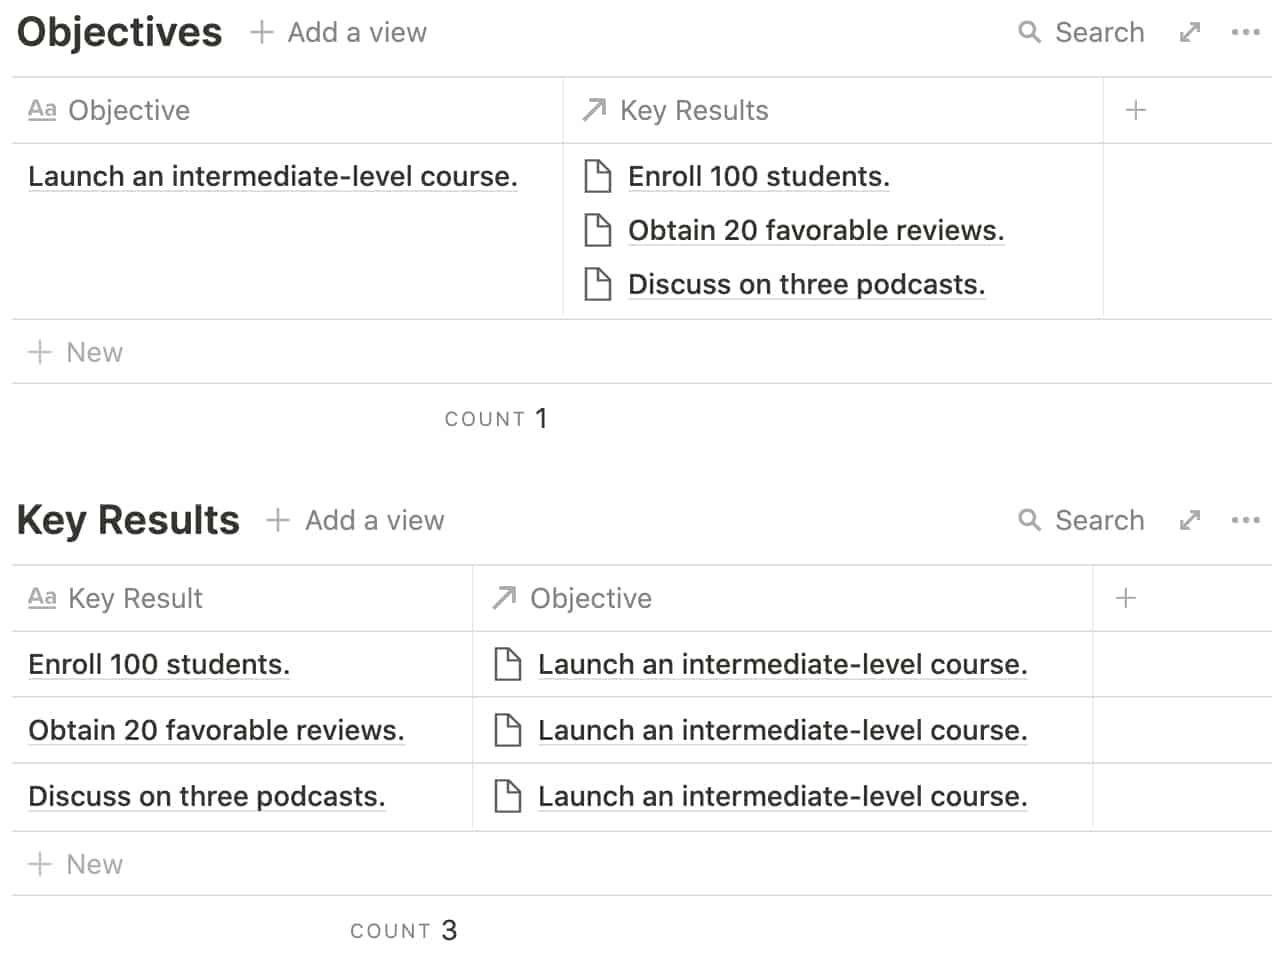
Objectives and Key Results (OKRs) is a widely employed system of goal tracking, where objectives are qualitative aspirations and key results are measurable steps towards those goals. Here’s a quick example:
Objective: Successfully launch an intermediate-level course.
Key Result: Enroll 100 students.
Following the project-task model, Notion facilitates OKRs beautifully, as demonstrated in The Bulletproof Workspace. Objectives and key results are stored in master databases, then connected via reciprocal Relations. Objectives are the “parents” of key results.

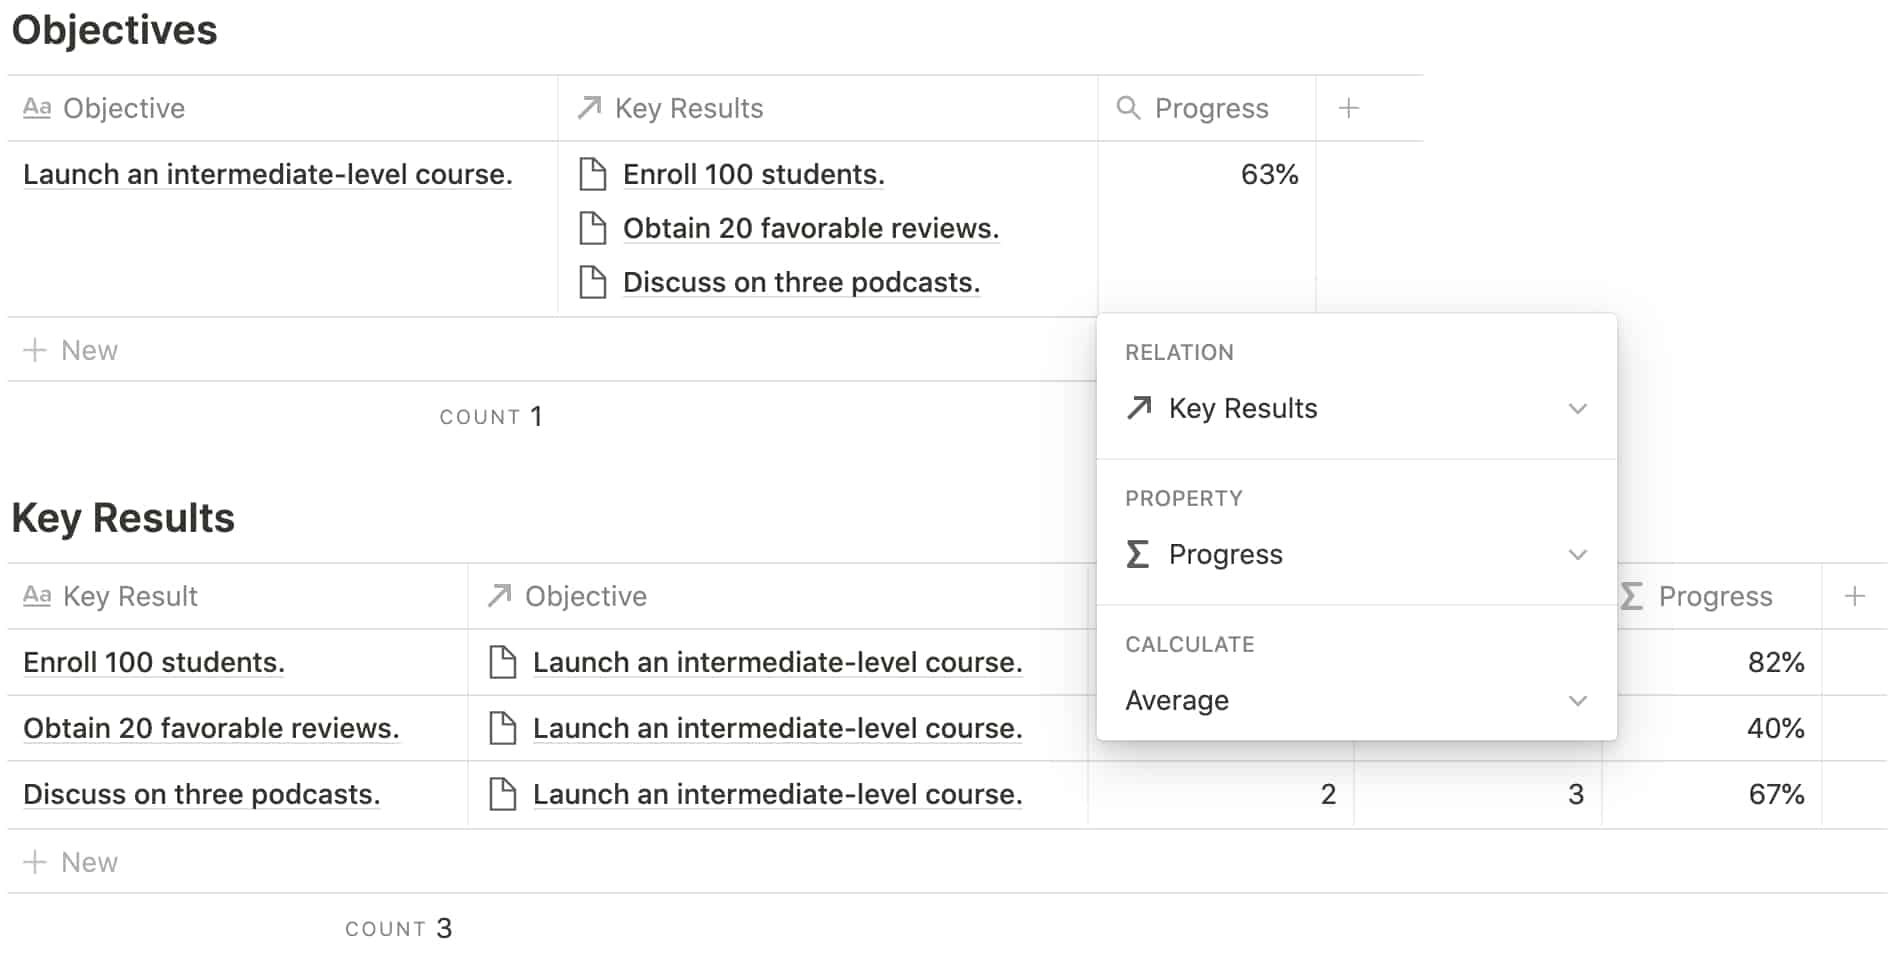
Rather than marking a key result complete with a binary checkbox, a Formula property calculates its progress by dividing its Current Value by its Target Value:

Here’s the formula, which rounds the result:
round(prop("Current Value") / prop("Target Value") * 100) / 100In the Objectives database, a Rollup property can calculate the average progress of each objective’s related key results to provide the overall progress of the objective:

Create visual progress bars.
In each of the above examples, a Progress property returns a number formatted as a percentage. A Formula property can then reference that percentage to generate a progress bar for a nice aesthetic in various database formats.
You can use a variety of characters in your progress bar, but the gist is that the slice() function references the Progress property to display a combination of “empty” and “filled” characters, such as “○” and “●.”

Here’s the formula used with circles:
slice("●●●●●●●●●●", 0, round(prop("Progress") * 10)) + slice("○○○○○○○○○○", 0, 10 - round(prop("Progress") * 10)) + " " + format(round(prop("Progress") * 100)) + "%"The progress bar is also among the demo databases available as a template on Notion Market.
If you encounter any roadblocks as you calculate and visualize progress, I’d love to lend a hand on Twitter.